Clean and safe water is not only crucial for maintaining healthy ecosystems but also essential for public health, community well-being, and economic stability. However, water pollution is worsening worldwide, driven primarily by rapid urban growth, industrial waste, and agricultural runoff. In response to this growing challenge, scientists and environmental managers are increasingly relying on environmetric techniques.
The techniques employ advanced statistical and computational methods in environmental research, allowing experts to interpret large, complex datasets from multiple water sources. By applying environmetric techniques, researchers can uncover pollution patterns, identify contamination sources, and monitor long-term trends with greater accuracy, offering insights that traditional monitoring approaches may overlook. This enhanced understanding plays a critical role in developing more effective strategies for managing and protecting water quality.
Revealing Hidden Patterns and Pollution Sources
One of the key advantages of environmetric analysis lies in its ability to uncover hidden pollution sources and spatial patterns that may not be immediately apparent through conventional methods. Environmetric techniques such as Cluster Analysis (CA) and Principal Component Analysis (PCA) are employed to classify water quality monitoring stations based on similarities in their data. These techniques help identify pollution hotspots and distinguish between various sources of contamination, including industrial discharges, agricultural runoff, and natural environmental factors. The application of these techniques supports the development of water management strategies that are precise, efficient, and highly effective.
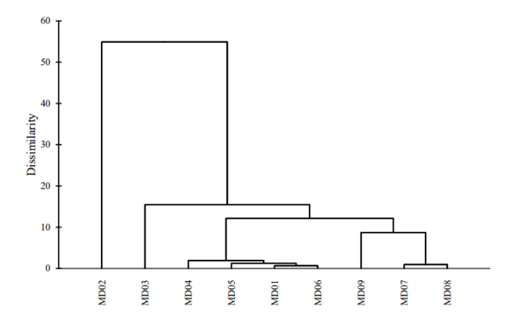
The dendrogram displays the CA results, showing the grouping of the water quality monitoring stations.
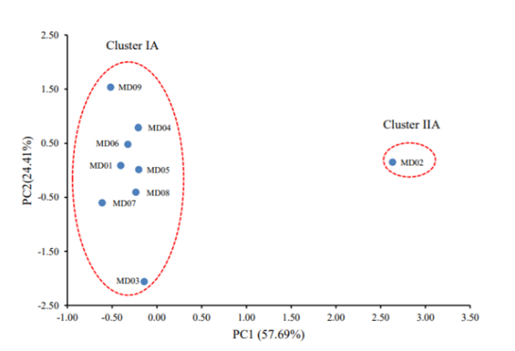
PCA identifies groups of water quality monitoring stations that share similar data characteristics
For example, PCA can highlight how high concentrations of ammonia nitrogen (NH₃-N) and biological oxygen demand (BOD) in certain parts of a river are consistently associated with nearby agricultural activities. Additionally, CA reveals that monitoring stations located near industrial zones tend to exhibit similar chemical profiles and the same sources of pollution in the area.
Pinpointing Key Pollutants and Their Impact
Other environmetric analyses offer further validation of these findings while helping to pinpoint the most influential pollutants. Discriminant Analysis (DA), for instance, enhances and confirms the group classifications produced by CA and PCA by identifying the variables that contribute most significantly to differences between monitoring sites. Specifically, if two regions display distinct chemical profiles, DA can determine which pollutants are primarily responsible for this divergence.
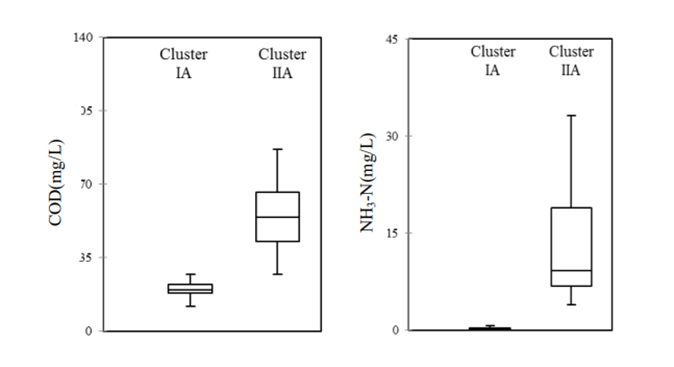
DA identifies the variables that contribute most to the differences between clusters.
Multiple Linear Regression (MLR) quantifies the correlations between contaminants and overall water quality. Studies conducted in countries such as Malaysia have shown that chemical oxygen demand (COD), BOD, and ammonia nitrogen are among the most significant contributors to water degradation, particularly near industrial zones such as rubber processing facilities. This analysis provides environmental managers with information needed to identify and prioritise the main factors contributing to water degradation.
Informing Better Policies and Predictive Management
Environmetric approaches are powerful not only for identifying existing water quality issues, but also for forecasting and strategic planning. The approaches help predict future changes in water quality by modelling pollutant behaviour over time. They also facilitate the evaluation of existing laws and contribute to the development of more effective policies.
These findings enable local authorities and policymakers to develop targeted pollution control strategies, make informed decisions about investing in water treatment infrastructure, and strengthen the communication of environmental concerns to the public. The industrial sector also benefits from data-driven recommendations that promote regulatory compliance and environmental responsibility
References
Azhar, S.C., Aris, A.Z., Yusoff, M.K., Ramli, M.F., and Juahir, H. 2015. Classification of River Water Quality Using Multivariate Analysis. Procedia Environmental Sciences 30: 79-84.
Bakan, G., Özkoc, H.B., Tülek, S., and Cüce, H. 2010. Integrated environmental quality assessment of Kızılırmak river and its coastal environment. Turkish Journal of Fisheries and Aquatic Sciences 10(4): 453–462.
Baker, A. 2003. Land use and water quality. Hydrological Processes 17(12): 2499–2501.
Bengraine, K. and Marhaba, T.F., 2003. Using principal component analysis to monitor spatial and temporal changes in water quality. Journal of Hazardous Materials 100(1-3):179-195
Gazzaz, N.M., Aris, A.Z., and Juahir, H. 2012. Characterization of spatial patterns in river water quality using chemometric pattern recognition techniques. Marine Pollution Bulletin 64(4): 688–698.
by : Dr. Shah Christirani Azhar
Chemistry Lecturer ASPutra
Date of Input: 07/08/2025 | Updated: 07/08/2025 | hasniah
MEDIA SHARING